
Start Trading on 1Win: Cryptos, Stocks, Fiat & More
The 1Win “Trading” section is a unique platform for currency trading. Try yourself as a real trader, trading BTC, ETH, MNX, INR, USD, etc. A wide range of assets awaits you: fiat money, cryptocurrencies, stocks, indices.

Understanding 1Win Trade
Trading 1Win is a specialised section on the 1Win website, which is designed for trading digital coins, fiat money, indices and stocks. This is a unique opportunity to bet on fluctuations in the value of assets and profit with correct forecasts.
Assortment of assets for trading:
- Cryptocurrencies: Bitcoin (BTC), Ethereum (ETH), Litecoin (LTC) and others.
- Fiat currencies: US dollar (USD), euro (EUR), British pound (GBP), Canadian dollars (CAD) and others;
- Stocks: Apple, Tesla, Amazon (AMZN), Google, Meta and others;
- Indices: S&P 500, NASDAQ, Dow Jones, etc.
Principle of 1Win Trade
1Win acts as a market maker, meaning the platform acts as both a seller and a buyer, ensuring liquidity and trade continuity. Here’s how it works:
- Pricing. 1Win sets Ask and Bid prices for each traded asset. Rate is determined based on market data and algorithmic calculations.
- Ask and Bid. Ask price is the price at which you can buy an asset and Bid is the price at which you can sell. The difference between the two is called the spread and is a source of income for 1Win. It varies depending on volatility and trading activity on the market.
- Leverage. The Betting platform offers leverage, allowing you to trade with amounts exceeding the user’s real capital. As a result, both potential profits and risks are increased.
- Trading platforms. Users can trade via the web platform or the mobile 1Win app, available for Android and iOS.
1Win has created a dynamic and efficient trading environment where traders can react quickly to market changes and implement numerous trading strategies.
Rules and Features of Trading
Trading is governed by specific rules and has unique features, making the process of concluding deals clear and transparent:
- Transaction amount. The minimum amount for buying/selling assets is 1 USD, which allows you to start with small investments.
- Leverage. 1Win offers leverage up to 1:100, allowing you to increase the volume of trading operations many times more than with real capital.
- Types of orders. Traders can use market orders to buy or sell instantly at the current market price, limit orders to trade at a price that is better than the current price, and stop orders to minimise losses.
- Trading tools. Various tools including charts, technical indicators and graphical tools (e.g. Fibonacci lines) are provided to assist in market research.
- Accessible tools for analysis. The platform provides access to up-to-date market data, news and research to help you make informed decisions.
From Theory to Practice: an Example of Trading on 1Win
Let’s assume that you are analysing the market and assume that the Bitcoin exchange rate will rise. At the current moment the price of Bitcoin is: Ask – 40,000 USD (the price at which you can buy), Bid – 39,900 USD (the price at which you can sell).
Your actions:
- You decide to seize the moment and open a long position, buying Bitcoin at the Ask price, i.e. for 40,000 USD;
- After the purchase, the price of Bitcoin really goes up and reaches 42,000 USD;
- You decide to lock in your profit and sell Bitcoin at the current Bid price, i.e. for 42,000 USD.
Profit Calculation:
- The purchase price of Bitcoin is 40,000 USD.
- The selling price of Bitcoin is 42,000 USD.
- Income – 2,000 USD.
This example shows how predicting market fluctuations and strategic decisions at 1Win ensure profits.
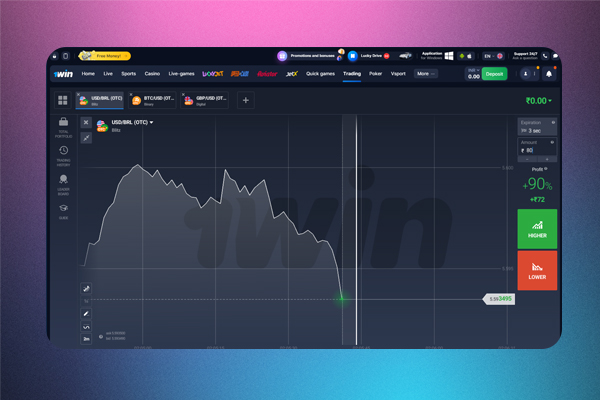
Navigating the 1Win Trading Interface
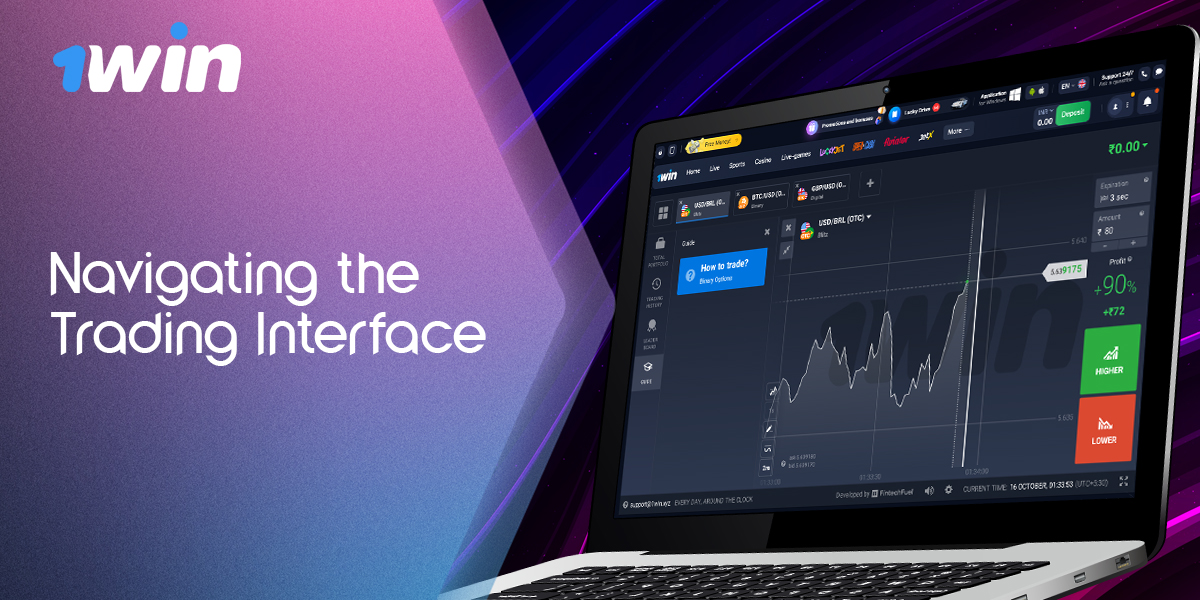
The main part of the interface is occupied by the chart, which shows the dynamics of currency rates, shares and indices in real time. It is intended for analysing market trends and making informed trading decisions.
Sidebar: Management and Analytics
On the left are buttons for accessing important functions:
- “My portfolio”. This displays information about your current investments, including open positions and trading results.
- “History of trade”. It contains data on completed trades, which helps to analyse trading activity and build strategies for the future.
On the top panel there are icons providing access to different types of options: “Blitz,” “Binary,” “Digital”. These instruments offer different trading conditions, allowing you to choose the most suitable style.
Information about Trading Pairs
To view information about a trading pair, just touch the “Info” icon. The “Information” tab reflects:
- Current rate fluctuations;
- Asset Value;
- Traders’ mood (neutral, positive, negative).
The “Trading conditions” section shows key parameters of trades, including minimum investment, commission, expected profit and trading schedule.
OTC (over-the-counter) trading is mentioned next to pairs that can be traded even when markets are closed, with algorithmically generated quotes.
Analytical Tools
The trading interface on 1Win is designed so that even a novice user can quickly navigate the world of financial markets and make informed decisions.
Traders can choose between different types of charts, each suitable for specific analytical purposes:
- Linear – shows the change in the price of an asset over time by connecting individual price points with a line.
- Candlesticks – reflects the opening, closing, highs and lows of prices for a certain period;
- Bars – similar to candlestick, but presents information through a sequence of vertical lines, indicating opening and closing prices with horizontal marks;
- Heikin-Ashi is a variation of the candlestick chart that smooths out price fluctuations to identify trends in trading.
The time size of a candle determines the interval over which each candle or bar on the chart is formed:
- Second ranges (5, 10, 15, 30 seconds) allow you to see instantaneous changes for high-speed trading;
- Minute ranges (1, 2, 5, 10, 15, 30 minutes) are used for short-term analysis;
- Hourly ranges (1, 2, 4 hours) and more (1 day, 30 days) are suitable for long-term market analysis.
Graphical Tools
The platform provides graphical tools for technical analysis of the market:
- Trend lines – determine the direction of market movement;
- Support and resistance lines – indicate the levels at which the price may change;
- Sections, rays – tools for marking specific price levels;
- Fibonacci lines – help predict potential price swing points.
There are mathematical functions to analyse market trends:
- Impulse – determines the rate of change in value;
- Trending – shows the direction of market movement;
- Volatilities – reflect the degree of price volatility;
- Moving averages – smooth out price data by highlighting the trend.
- Volume – measures the number of trades in a period.
The choice of time interval allows you to watch trading on different time horizons, ranging from a few minutes to months.
On the right side of the chart, you will find the expiry date of the options, the set investment limits and the potential income. This information is important for planning operations and determining the investment strategy.
How to Join 1Win Trading?
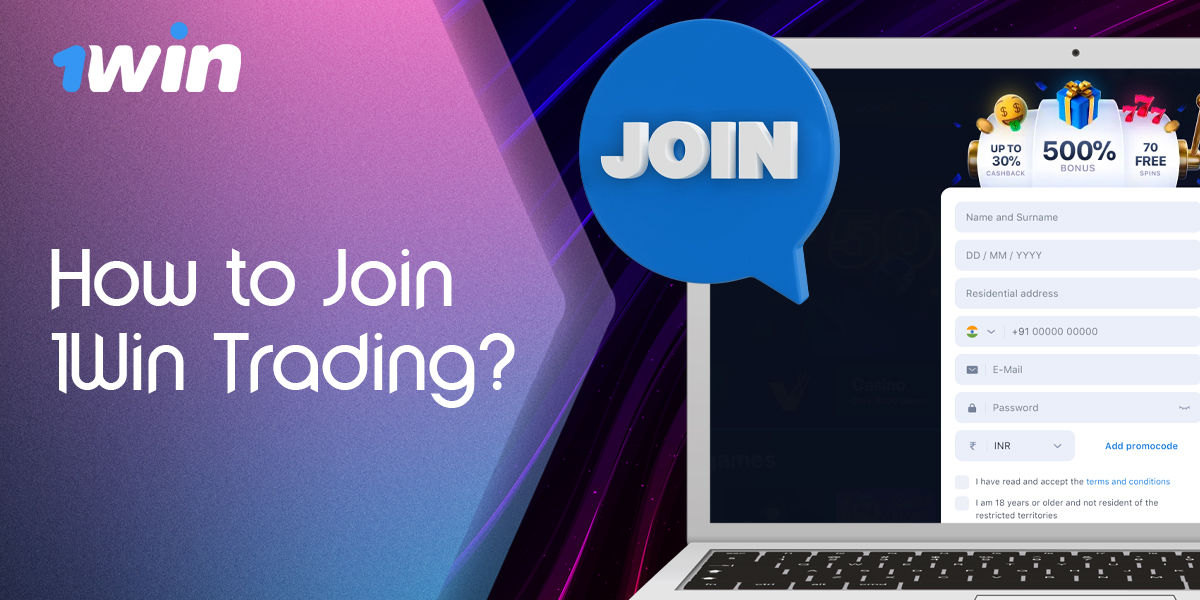
Betting site is a dynamic trading platform where anyone can trade assets. Registration at 1Win provides access to a user-friendly interface, analytics tools and global markets.
Use the instructions to start trading cryptocurrency, stocks or indices:
1
Create an account.
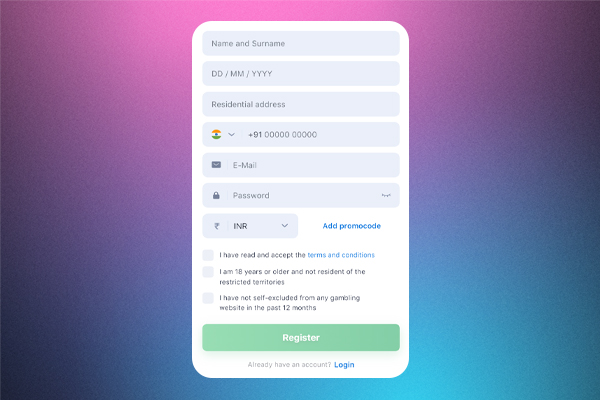
Go to the official 1Win website and click “Registration” at the top of the page. Enter your information: email, phone number, account currency. Give a password and follow the instructions to complete the registration.
2
Verify your profile.
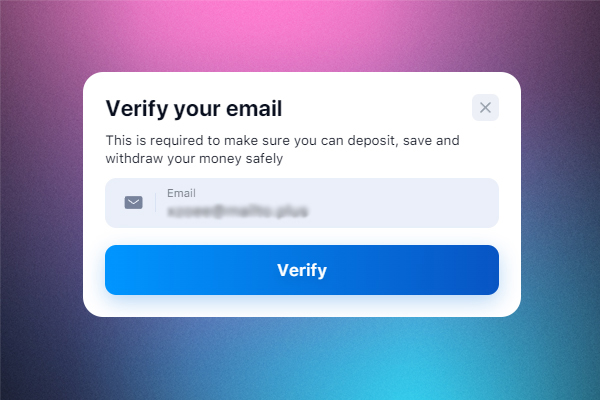
Go through the KYC process by submitting the requested documents to verify your identity.
3
Deposit funds to your account.

Go to the “Deposit” section and deposit funds using one of the available payment methods.
4
Access to trading.
Select the “Trading” section in the main menu of the site, decide on a trading pair (BTC/USD, ETH/USD, EUR/GBR, USD/MNX) and open an order.
Remember that you can only open one account on the 1Win website. Multi-accounting is against the rules of betting on the platform and threatens with blocking.
Winning Strategies for 1Win Trading
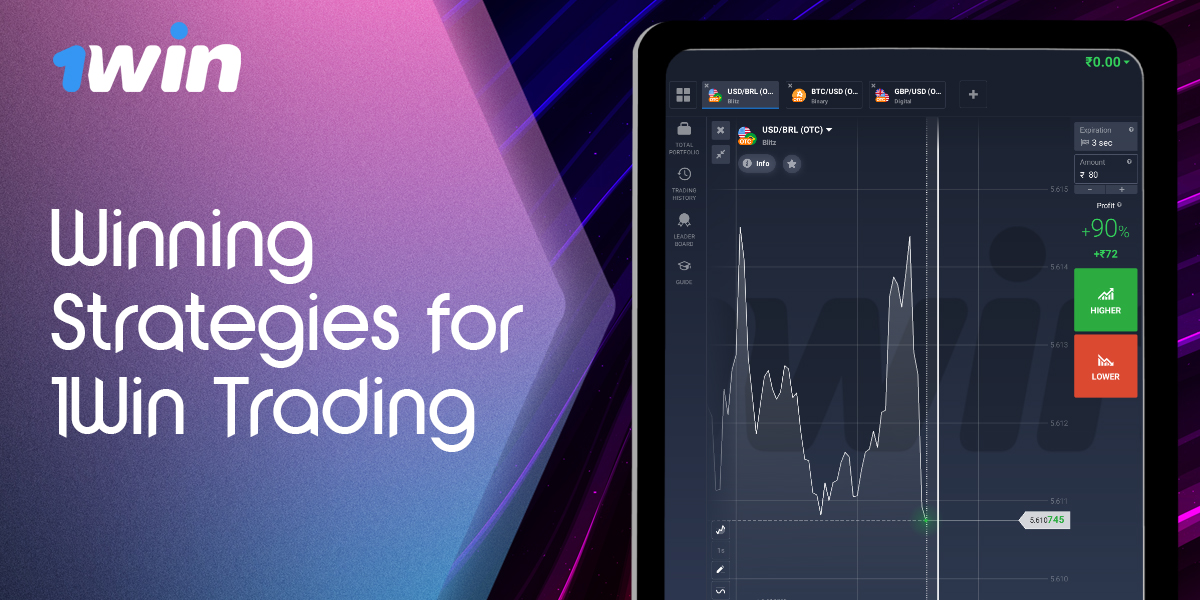
Trading is not just trading assets, it is the art of making decisions based on analysis. To become a successful trader, you need to apply effective strategies.
Scalping Strategy
Scalping is a strategy aimed at profiting from short-term price fluctuations. A trader makes many trades in a day, each of which brings a small profit.
The main characteristics of scalping:
- Objective: to make money on small price changes, often within a few pips;
- Timeframe: short – M1 (1 minute), M5 (5 minutes) and M15 (15 minutes);
- Indicators: MACD to determine the trend direction, entry/exit point and Stochastic Oscillator to track the moment when the asset price may change.
Scalping allows you to quickly see the results of trading. Each trade is associated with low risk, thanks to clearly defined stop losses and take profits.
Suppose you are trading the EUR/USD currency pair:
- Position opening. You buy EUR/USD when MACD signals the crossing of the signal line from bottom to top.
- Stop Loss and Take Profit. You set a stop loss 10 pips below the buy price and take profit 5 pips above the buy price to protect yourself from large losses and to lock in profits.
- Position closing. The deal is closed automatically when one of these levels is reached.
Scalping requires a clear understanding of market dynamics and quick decisions.
Swing Trading Strategy
Swing trading is an approach to trading that aims to profit from medium-term market fluctuations. Traders keep trades open for several days to several weeks in an attempt to capitalise on price differences.
The main characteristics of swing trading:
- Objective: to profit from significant fluctuations in asset prices;
- Timeframe: long – H1 (1 hour), H4 (4 hours) and D1 (1 day).
- Indicators: Bollinger Bands to determine market volatility, support/resistance levels and Moving Averages to identify trend and potential reversal points.
Let’s say you decide to trade Apple stock:
- Position Opening. You buy a stock when the price breaks the upper boundary of the Bollinger Bands, indicating the strength of the trend.
- Stop Loss and Take Profit. Stop loss is placed behind the lower boundary of Bollinger Bands, and take profit is set at the next resistance level implied by the trend.
- Position Closing. The transaction is closed when the price reaches the Take Profit or Stop Loss level.
The strategy is suitable for traders who prefer a balanced approach to trading with the possibility of in-depth analysis for decision making.
1Win Trading App
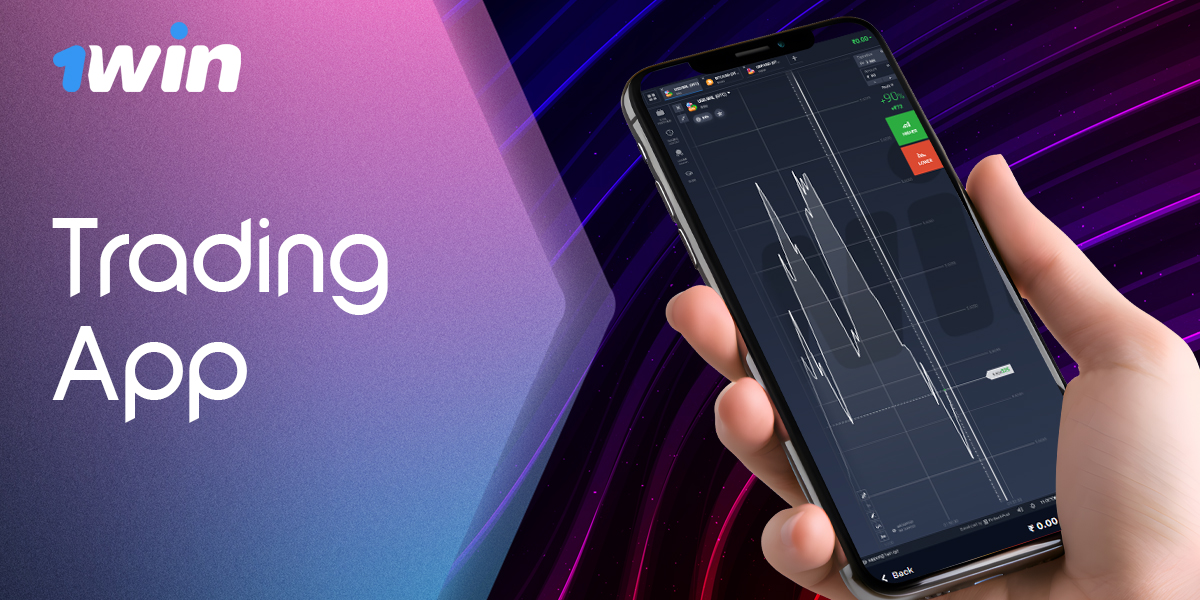
Participate in asset trading with 1Win trading app. It is a multitasking software for Android and iOS, in which all gaming products and services of the company are implemented. Mobile players from India have access to sports betting, casino games, bonuses, communication with tech support, deposit and withdrawal of funds.
The integrated trading section offers the same features as the desktop platform, including analytics tools, trading operations and portfolio management.
Frequently Asked Questions
What is Trading on 1Win?

1Win trading is a section on the 1Win platform where you can buy and sell various assets such as cryptocurrencies, fiat currencies, stocks and indices.
How is Trading on 1Win Different from Betting on Sports?
In sports betting, you bet on the outcome of a match, while in trading you predict fluctuations in the value of assets.
How Long Can I Keep a Trading Position Open?
The time during which you can keep a trading position open is not limited.
What is Leverage?
Leverage is a tool that allows you to make trades for an amount greater than your balance.
Stop Loss – What Is It?
A stop loss is an order that automatically closes your position when a certain price is reached.